Release 3.2: 🔎 Knowing what to optimize
Friday, July 5, 2024
On this page
For this release, we mainly focused on improving tooling to more easily track down performance issues. Concretely, we improved our query explain output, started running multiple benchmarks in our CI to avoid performance regressions, and applied several performance improvements that were identified following these changes.
🔎 Query explain improvements
Comunica has had several query explain functionalities for a while now, to show how a query is parsed, optimized (logical), and executed (physical). However, the physical plan output tended to be very verbose, which made it difficult to draw conclusions from.
In this update, the physical plan output has undergone three main changes:
- The output from joins (especially Bind Joins) are compacted, so that recurring patterns in sub-plans are not repeated. Instead, a counter is added showing how many times a certain sub-plan was executed.
- The default output is a compact text representation instead of the previous JSON output. (The old JSON representation is still available when passing the
physical-jsonexplain value) - Additional metadata is emitted, such as cardinalities and execution times.
For example, outputs such as the following can now be obtained:
$ node bin/query.js https://fragments.dbpedia.org/2016-04/en \
  -q 'SELECT ?movie ?title ?name
WHERE {
  ?movie dbpedia-owl:starring [ rdfs:label "Brad Pitt"@en ];
         rdfs:label ?title;
         dbpedia-owl:director [ rdfs:label ?name ].
  FILTER LANGMATCHES(LANG(?title), "EN")
  FILTER LANGMATCHES(LANG(?name),  "EN")
}' --explain physical
project (movie,title,name)
  join
    join-inner(bind) bindOperation:(?g_0 http://www.w3.org/2000/01/rdf-schema#label "Brad Pitt"@en) bindCardEst:~2 cardReal:43 timeSelf:2.567ms timeLife:667.726ms
      join compacted-occurrences:1
        join-inner(bind) bindOperation:(?movie http://dbpedia.org/ontology/starring http://dbpedia.org/resource/Brad_Pitt) bindCardEst:~40 cardReal:43 timeSelf:6.011ms timeLife:641.139ms
          join compacted-occurrences:38
            join-inner(bind) bindOperation:(http://dbpedia.org/resource/12_Monkeys http://dbpedia.org/ontology/director ?g_1) bindCardEst:~1 cardReal:1 timeSelf:0.647ms timeLife:34.827ms
              filter compacted-occurrences:1
                join
                  join-inner(nested-loop) cardReal:1 timeSelf:0.432ms timeLife:4.024ms
                    pattern (http://dbpedia.org/resource/12_Monkeys http://www.w3.org/2000/01/rdf-schema#label ?title) cardEst:~1 src:0
                    pattern (http://dbpedia.org/resource/Terry_Gilliam http://www.w3.org/2000/01/rdf-schema#label ?name) cardEst:~1 src:0
          join compacted-occurrences:2
            join-inner(multi-empty) timeSelf:0.004ms timeLife:0.053ms
              pattern (http://dbpedia.org/resource/Contact_(1992_film) http://dbpedia.org/ontology/director ?g_1) cardEst:~0 src:0
              filter cardEst:~5,188,789.667
                join
                  join-inner(nested-loop) timeLife:0.6ms
                    pattern (http://dbpedia.org/resource/Contact_(1992_film) http://www.w3.org/2000/01/rdf-schema#label ?title) cardEst:~1 src:0
                    pattern (?g_1 http://www.w3.org/2000/01/rdf-schema#label ?name) cardEst:~20,013,903 src:0
      join compacted-occurrences:1
        join-inner(multi-empty) timeSelf:0.053ms timeLife:0.323ms
          pattern (?movie http://dbpedia.org/ontology/director ?g_1) cardEst:~118,505 src:0
          pattern (?movie http://dbpedia.org/ontology/starring http://wikidata.dbpedia.org/resource/Q35332) cardEst:~0 src:0
          filter cardEst:~242,311,843,844,161
            join
              join-inner(symmetric-hash) timeLife:36.548ms
                pattern (?movie http://www.w3.org/2000/01/rdf-schema#label ?title) cardEst:~20,013,903 src:0
                pattern (?g_1 http://www.w3.org/2000/01/rdf-schema#label ?name) cardEst:~20,013,903 src:0

sources:
  0: QuerySourceHypermedia(https://fragments.dbpedia.org/2016-04/en)(SkolemID:0)
⚙️ Continuous performance tracking
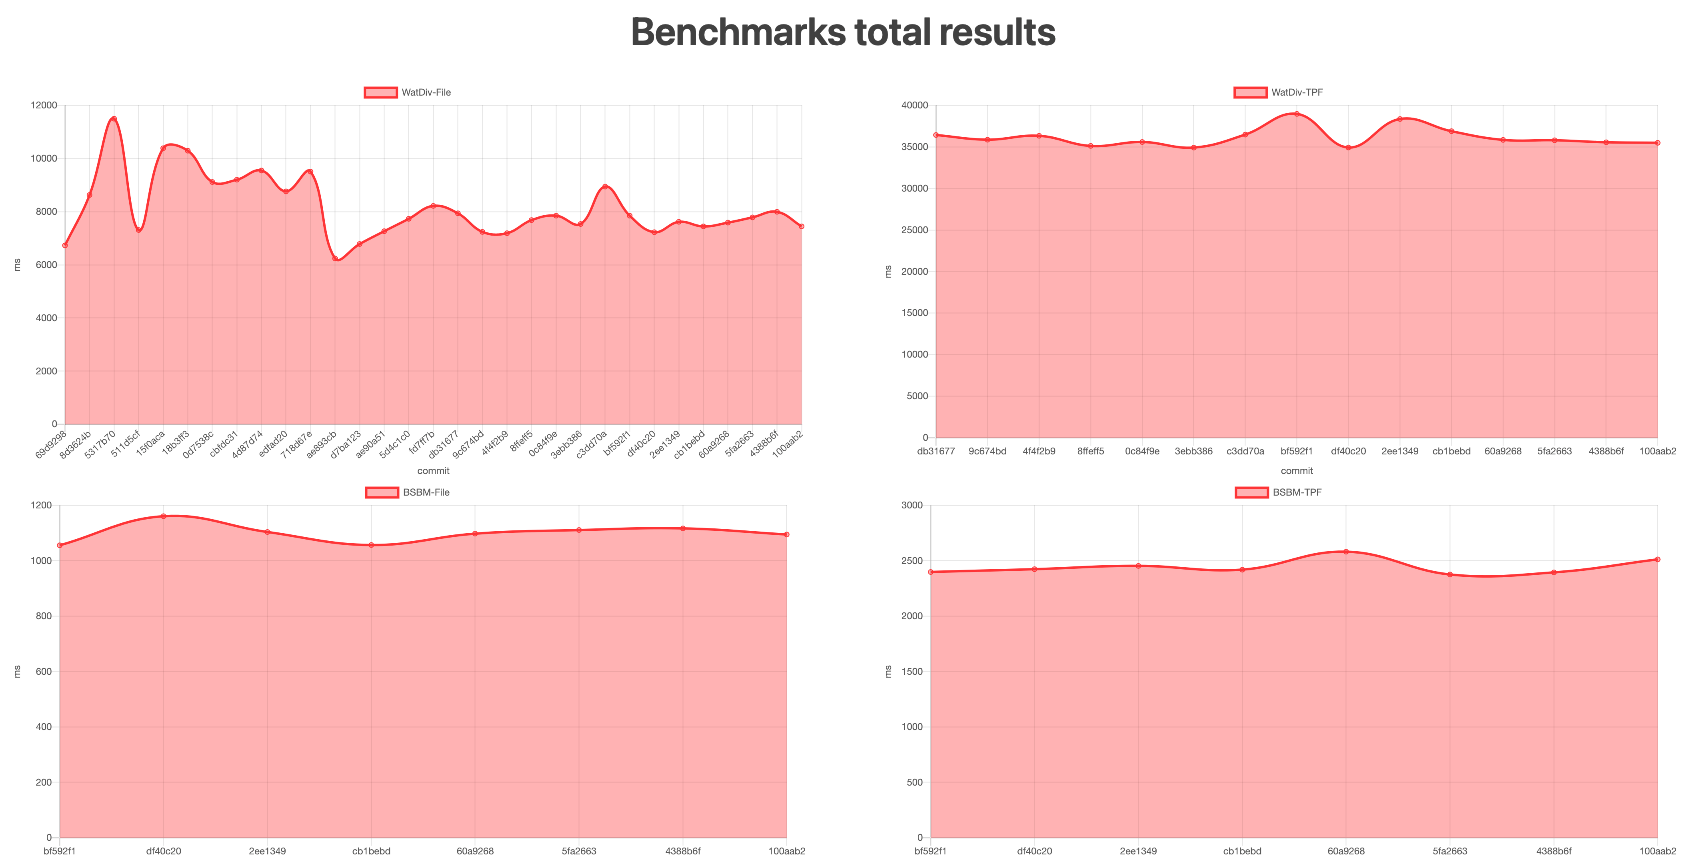
In order to keep better track of the evolution of Comunica's performance, we have added continuous performance tracking into our continuous integration. For various benchmarks, we can now see the evolution of execution times across our commit history. This allows us to easily identify which changes have a positive or negative impact on performance.
For considering the performance for different aspects, we have included the following benchmarks:
- WatDiv (in-memory)
- WatDiv (TPF)
- Berlin SPARQL Benchmark (in-memory)
- Berlin SPARQL Benchmark (TPF)
- Custom web queries: manually crafted queries to test for specific edge cases over the live Web
This allows us to inspect performance as follows:
Fluctuations in the graph are mainly caused by confounding variables in the GitHub Actions environment, such as running on different hardware and runner versions.
These results can be inspected in more close detail together with execution times per query separately.
🏎️ Performance improvements
Thanks to the improvements to our physical query plan output and the continuous performance tracking, we identified several low-hanging efforts for improving performance:
- Addition of a hash-based optional join actor
- Tweaking constants of our internal join cost model
- Making optional hash and bind join only work with common variables
Besides these changes, we have many more performance-impacting changes in the pipeline for upcoming releases!
Full changelog
Besides this, several fixes were applied, as well as various changes and additions. If you want to learn more about all changes, check out the full changelog.
